
“Beyond the Numbers: India’s School Education Journey (2022–23 to 2025–26)”
Executive Snapshot — 2025-26
The latest UDISE+ 2025-26 report shows India’s school education system continuing to strengthen across nearly every indicator tracked since 2022-23. The headline figures for the current year are:
| 14.67 lakh Total Schools | 1.03 crore Total Teachers | 24.72 crore Total Enrolment | 24:1 Overall PTR |
This report traces each indicator across all four years, with a chart, a data table, and a short analysis for every parameter.
1. Teacher Availability
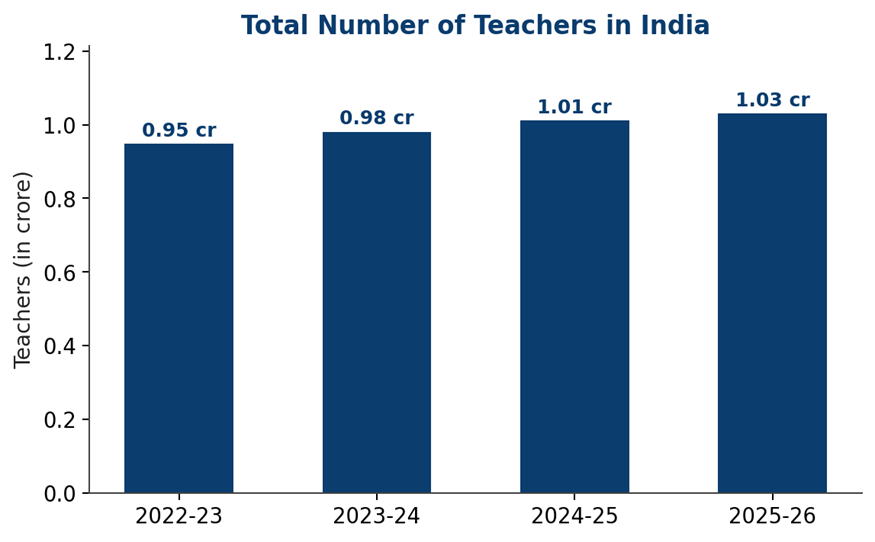
The total number of teachers in India crossed the 1-crore mark for the first time in 2024-25 and has continued to rise into 2025-26, reaching approximately 1.03 crore.
| Indicator | 2022-23 | 2023-24 | 2024-25 | 2025-26 |
| Total Teachers | 94,83,294 | 98,07,600 | 1,01,22,420 | ~1,03,00,000 (1.03 cr) |
Analysis: Teacher numbers have grown by roughly 8.6% over the four-year window (94.83 lakh → 103 lakh), a steady, uninterrupted increase each year. This directly supports the improving Pupil-Teacher Ratios seen below, and reflects sustained recruitment effort aimed at closing regional staffing gaps.
2. Pupil-Teacher Ratio (PTR)
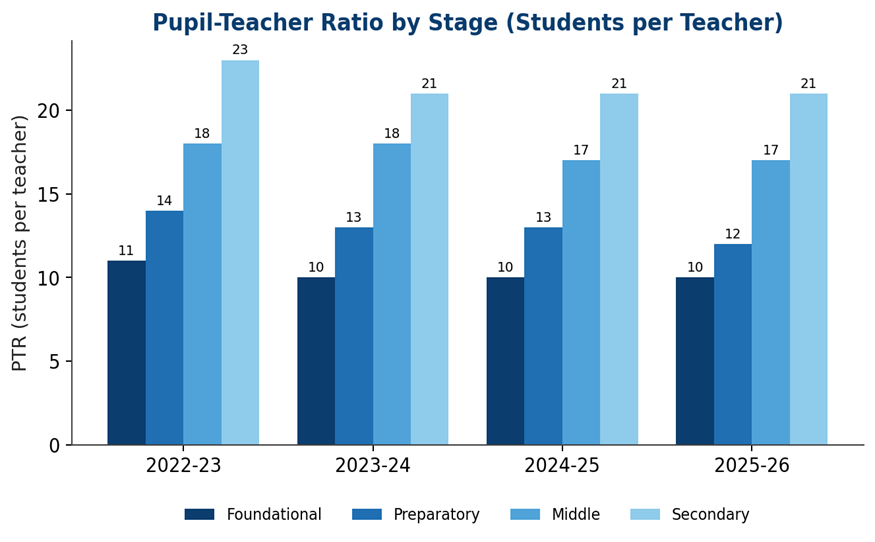
PTR measures how many students, on average, are taught per teacher at each stage. A lower ratio generally allows more individual attention. All stages remain comfortably within the NEP 2020 benchmark of 30:1.
| Stage | 2022-23 | 2023-24 | 2024-25 | 2025-26 |
| Foundational | 11 | 10 | 10 | 10 |
| Preparatory | 14 | 13 | 13 | 12 |
| Middle | 18 | 18 | 17 | 17 |
| Secondary | 23 | 21 | 21 | 21 |
Analysis: PTR has improved or held steady at every stage over four years. The Secondary stage saw the largest gain (23→21), and Preparatory improved most recently (13→12 in 2025-26). Foundational and Middle stages have essentially stabilised at favourable ratios, suggesting the earlier gains from 2022-23 to 2023-24 are now being maintained rather than repeated.
3. Dropout Rate
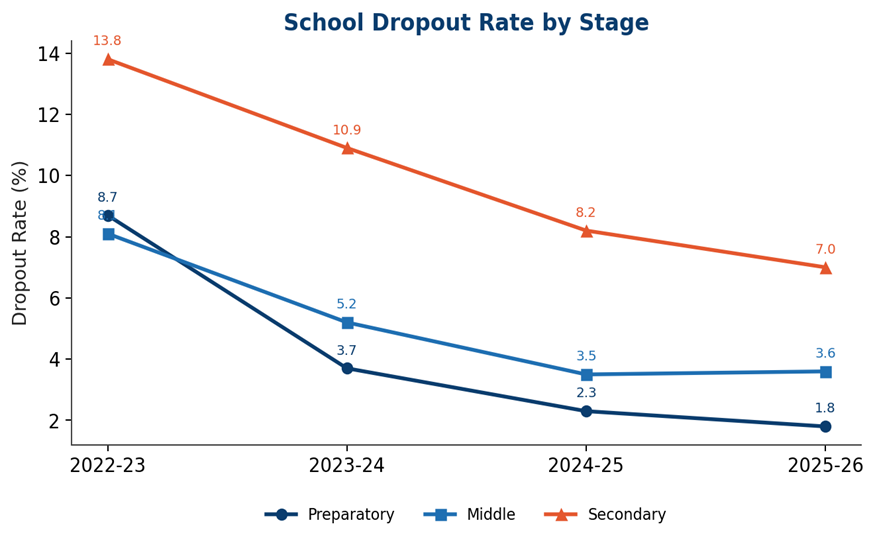
Dropout rate is the percentage of enrolled students who leave school before completing a stage. Lower is better.
| Stage (%) | 2022-23 | 2023-24 | 2024-25 | 2025-26 |
| Preparatory | 8.7 | 3.7 | 2.3 | 1.8 |
| Middle | 8.1 | 5.2 | 3.5 | 3.6 |
| Secondary | 13.8 | 10.9 | 8.2 | 7.0 |
Analysis: Dropout has fallen sharply and consistently at the Preparatory (8.7%→1.8%) and Secondary (13.8%→7.0%) stages — both cut by more than half. The Middle stage improved strongly through 2024-25 (down to 3.5%) but ticked up marginally to 3.6% in 2025-26 — the only reversal in the entire dataset, and worth monitoring in next year’s report even though it remains far below the 2022-23 baseline.
4. Student Retention Rate
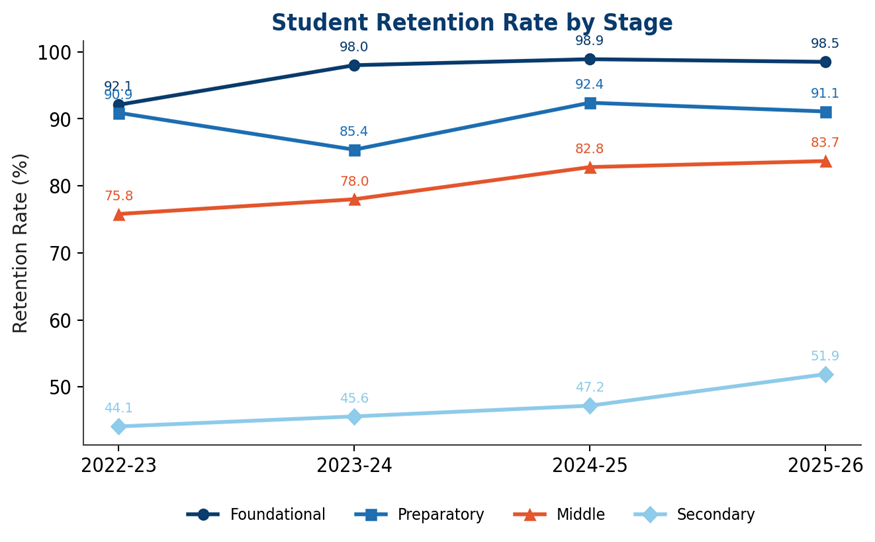
Retention rate is the percentage of students who continue enrolment through to the end of a stage. Higher is better.
| Stage (%) | 2022-23 | 2023-24 | 2024-25 | 2025-26 |
| Foundational | 92.1 | 98.0 | 98.9 | 98.5 |
| Preparatory | 90.9 | 85.4 | 92.4 | 91.1 |
| Middle | 75.8 | 78.0 | 82.8 | 83.7 |
| Secondary | 44.1 | 45.6 | 47.2 | 51.9 |
Analysis: Secondary-stage retention shows the most encouraging and consistent trend, rising from 44.1% to 51.9% — a gain of nearly 8 percentage points — crossing the halfway mark for the first time. Middle-stage retention has also climbed steadily each year (75.8%→83.7%). Foundational and Preparatory retention improved sharply through 2024-25 but eased slightly in 2025-26, mirroring the same pattern seen in dropout rates for those stages.
5. Gross Enrolment Ratio (GER)
GER expresses total enrolment at a stage as a percentage of the population in the corresponding official age group; it can exceed or fall short of 100% depending on over-age/under-age enrolment.
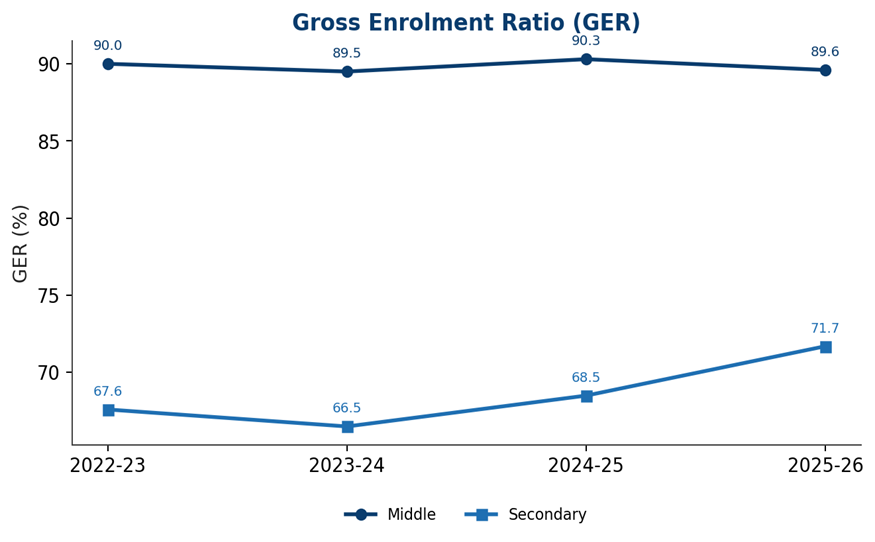
| Stage (%) | 2022-23 | 2023-24 | 2024-25 | 2025-26 |
| Middle | 90.0 | 89.5 | 90.3 | 89.6 |
| Secondary | 67.6 | 66.5 | 68.5 | 71.7 |
Analysis: Secondary-stage GER shows the clearest upward trend in the whole report, rising from 66.5% in 2023-24 to 71.7% in 2025-26 — a jump of over 3 points in the latest year alone, indicating meaningfully expanding access to senior schooling. Middle-stage GER has fluctuated in a narrow band around 89-90% across all four years, suggesting participation at that stage is already close to saturation and is not the current growth driver.
6. Transition Rate
Transition rate is the percentage of students completing one stage who go on to enrol in the next.
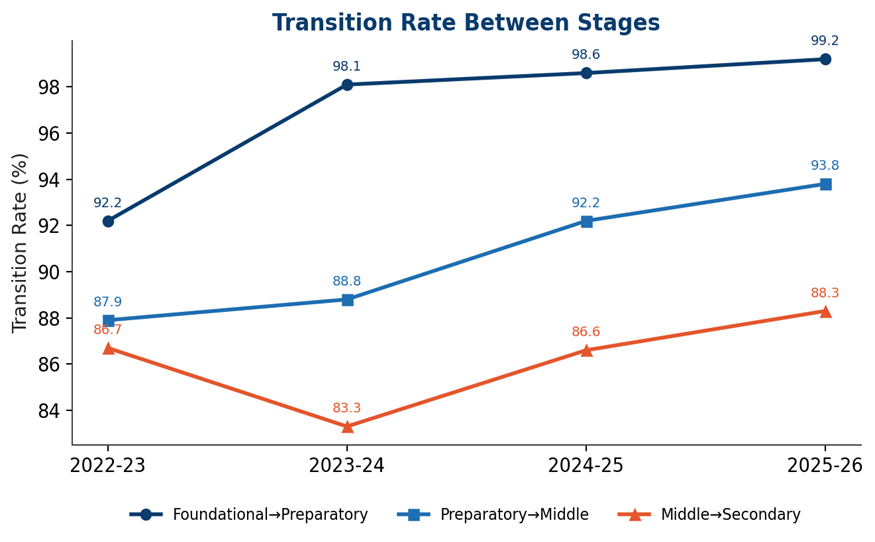
| Transition (%) | 2022-23 | 2023-24 | 2024-25 | 2025-26 |
| Foundational → Preparatory | 92.2 | 98.1 | 98.6 | 99.2 |
| Preparatory → Middle | 87.9 | 88.8 | 92.2 | 93.8 |
| Middle → Secondary | 86.7 | 83.3 | 86.6 | 88.3 |
Analysis: Every transition point has improved in every year without exception, making this the most uniformly positive indicator in the dataset. Foundational-to-Preparatory transition is now almost universal (99.2%). Preparatory-to-Middle has improved the most in percentage-point terms (87.9%→93.8%). Middle-to-Secondary dipped in 2023-24 before resuming its climb, and remains the weakest of the three links — consistent with Secondary being the stage with the lowest GER and retention.
7. Single-Teacher and Zero-Enrolment Schools
These two counts flag structural weak points: schools too small to be viably staffed (single-teacher) and schools with no students on roll (zero-enrolment), both targets for rationalisation.
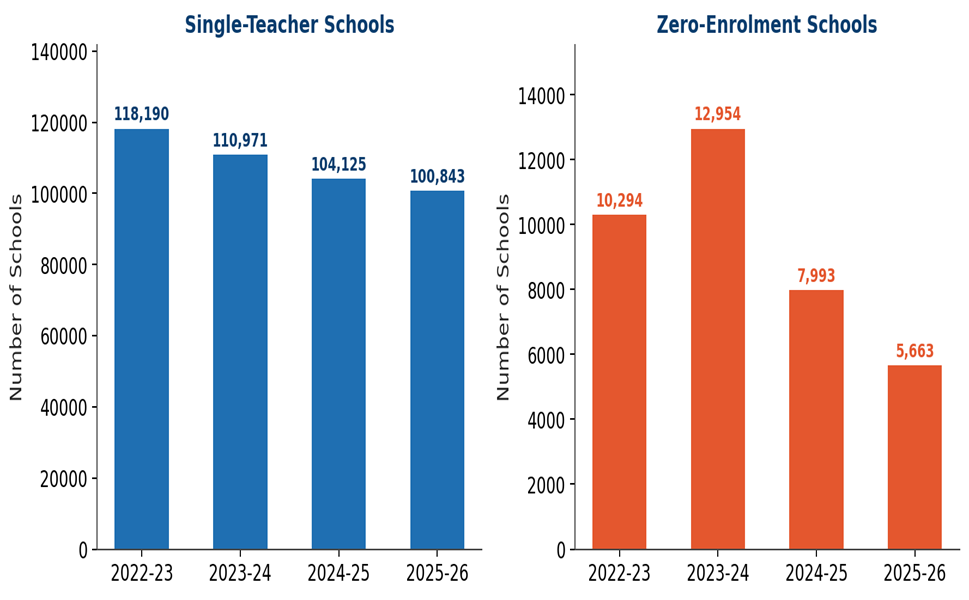
| Indicator (numbers) | 2022-23 | 2023-24 | 2024-25 | 2025-26 |
| Single-Teacher Schools | 1,18,190 | 1,10,971 | 1,04,125 | 1,00,843 |
| Zero-Enrolment Schools | 10,294 | 12,954 | 7,993 | 5,663 |
Analysis: Single-teacher schools have declined every year, down 15% cumulatively from 1.18 lakh to just under 1.01 lakh. Zero-enrolment schools tell a more uneven story — they actually rose in 2023-24 (to 12,954) before falling sharply in both 2024-25 and 2025-26, ending 45% below the 2022-23 level. The steep, consistent recent decline (a 38% drop in 2024-25 and a further 29% drop in 2025-26) suggests active rationalisation and merger of non-functional schools is now underway.
8. Digital Infrastructure
Share of schools with computer and internet access — a proxy for readiness for technology-enabled and digital learning.
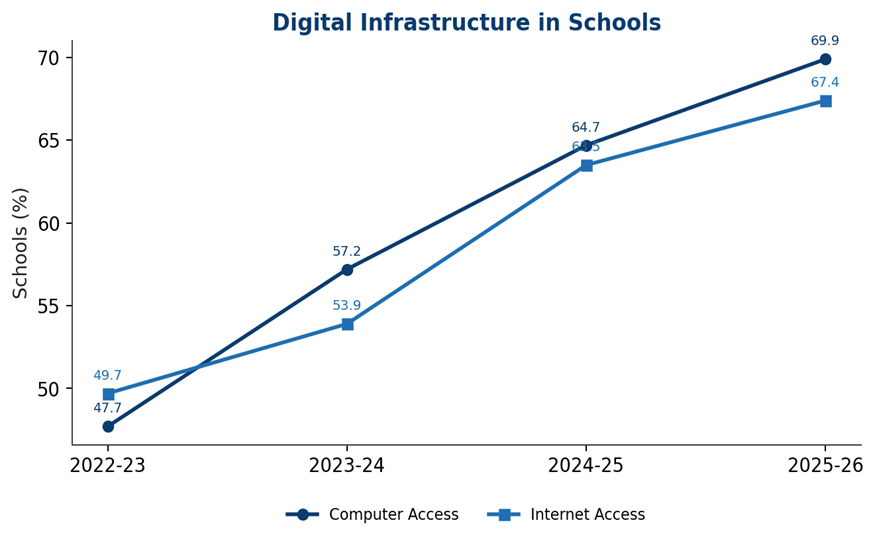
| Facility (%) | 2022-23 | 2023-24 | 2024-25 | 2025-26 |
| Computer Access | 47.7 | 57.2 | 64.7 | 69.9 |
| Internet Access | 49.7 | 53.9 | 63.5 | 67.4 |
Analysis: Digital infrastructure shows the fastest sustained growth of any category in this report. Computer access has risen 22 percentage points (47.7%→69.9%) and internet access 18 points (49.7%→67.4%) in just four years, with the pace of improvement actually accelerating in 2024-25 and 2025-26 rather than slowing down. Roughly seven in ten schools now have both facilities, though nearly a third of schools still lack them, leaving room for further investment.
9. Basic Infrastructure
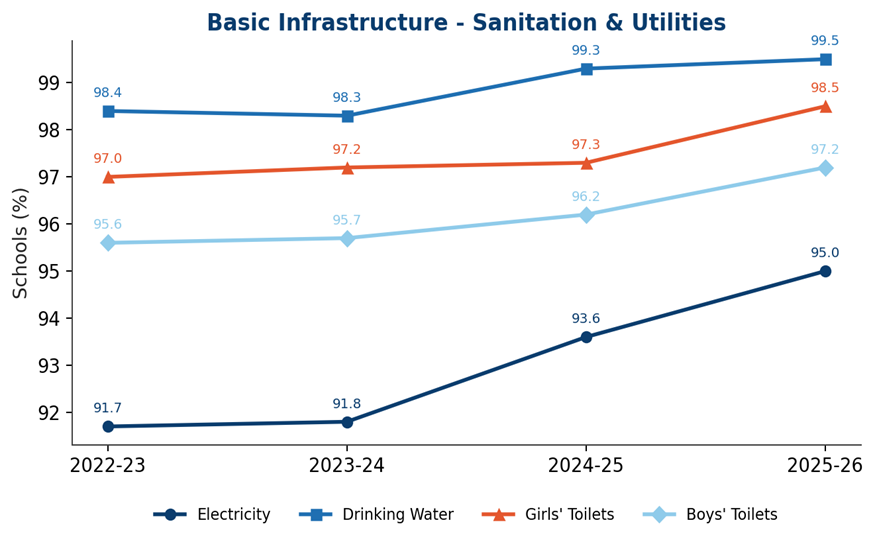
Coverage of essential facilities: electricity, drinking water, toilets and handwashing stations.
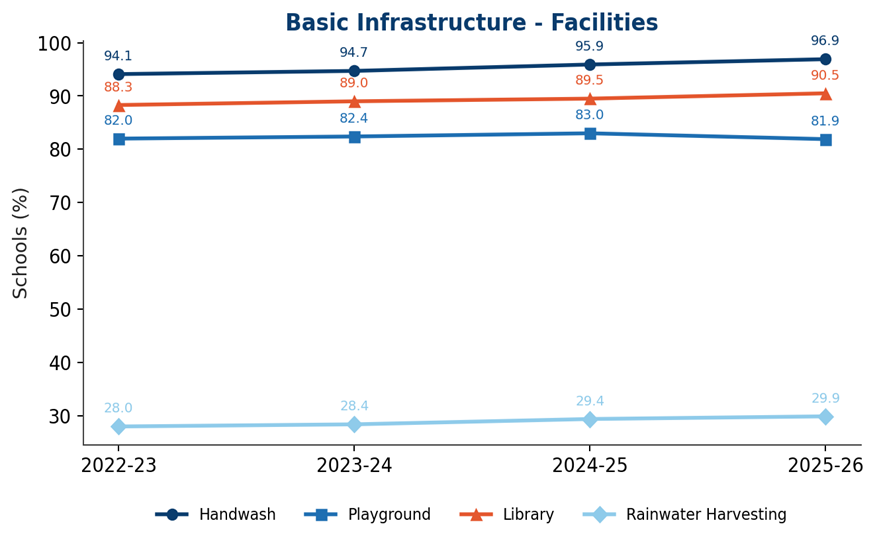
Coverage of additional amenities: playgrounds, libraries and rainwater harvesting.
| Facility (%) | 2022-23 | 2023-24 | 2024-25 | 2025-26 |
| Electricity | 91.7 | 91.8 | 93.6 | 95.0 |
| Drinking Water | 98.4 | 98.3 | 99.3 | 99.5 |
| Girls’ Toilets | 97.0 | 97.2 | 97.3 | 98.5 |
| Boys’ Toilets | 95.6 | 95.7 | 96.2 | 97.2 |
| Handwash | 94.1 | 94.7 | 95.9 | 96.9 |
| Playground | 82.0 | 82.4 | 83.0 | 81.9 |
| Library | 88.3 | 89.0 | 89.5 | 90.5 |
| Rainwater Harvesting | 28.0 | 28.4 | 29.4 | 29.9 |
Analysis: Core amenities — drinking water, toilets, electricity, handwash — are now nearly universal (95-99.5%) and have improved steadily each year. Library coverage has grown modestly but consistently (88.3%→90.5%). Two indicators stand out as laggards: rainwater harvesting remains stuck below 30% throughout the entire period, showing almost no meaningful progress, and playground availability actually declined slightly in 2025-26 (83.0%→81.9%) after three years of gains — likely reflecting land constraints in newly added or urban schools rather than an active loss of existing playgrounds.
10. Accessibility — Ramps with Handrails
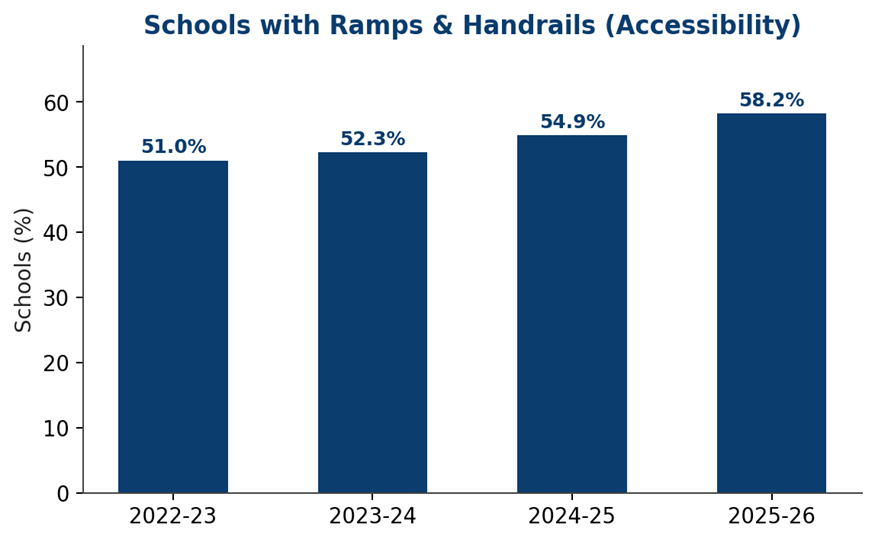
Share of schools equipped with ramps and handrails, a key marker of accessibility for students with disabilities.
| Indicator (%) | 2022-23 | 2023-24 | 2024-25 | 2025-26 |
| Ramps with Handrails | 51.0 | 52.3 | 54.9 | 58.2 |
Analysis: Accessibility infrastructure has improved every year, gaining over 7 percentage points in four years (51.0%→58.2%), with the pace picking up in the latest year (+3.3 points in 2025-26 alone, the largest single-year jump). Even so, more than 4 in 10 schools still lack ramps and handrails, making this one of the least-covered basic facilities alongside rainwater harvesting.
11. Gender Representation
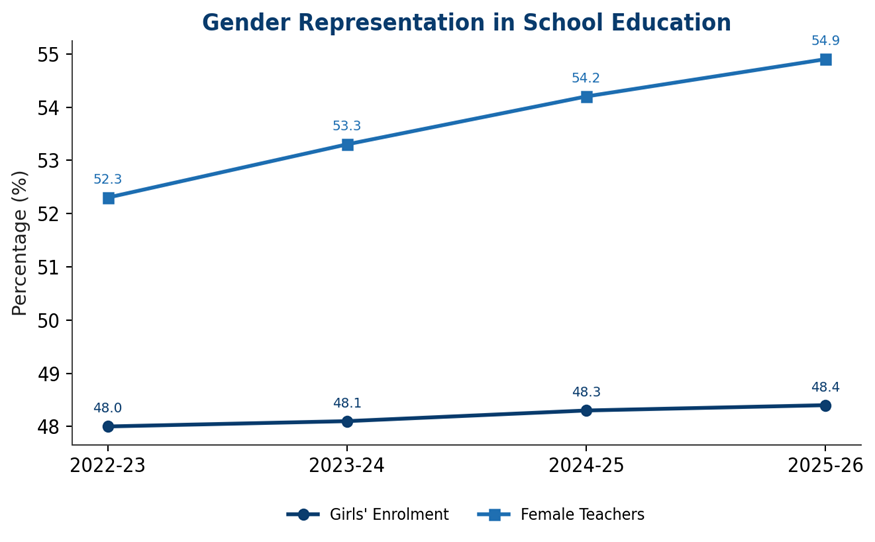
Share of girls in total student enrolment and share of women in the teaching workforce.
| Indicator (%) | 2022-23 | 2023-24 | 2024-25 | 2025-26 |
| Girls’ Enrolment | 48.0 | 48.1 | 48.3 | 48.4 |
| Female Teachers | 52.3 | 53.3 | 54.2 | 54.9 |
Analysis: Girls’ enrolment has been essentially stable near gender parity (48.0%→48.4%) throughout the period — there was little imbalance to correct, and the figure has inched upward slightly each year. Female representation in the teaching workforce has grown more noticeably, from 52.3% to 54.9%, meaning women now make up a growing majority of teachers — a trend that has held in every single year without exception.
Overall Conclusion
Across all eleven parameters tracked from 2022-23 to 2025-26, the UDISE+ data shows a school education system that has improved almost monotonically — most indicators moved in the favourable direction in every single year, with very few exceptions:
- Consistently strong, uninterrupted improvement: Teacher numbers, Foundational-to-Secondary transition rates, single-teacher school reduction, digital infrastructure, basic amenities, ramps/handrails, and female teacher share.
- Strong overall improvement with one minor wobble: Dropout and retention at the Preparatory/Foundational stages (excellent through 2024-25, slight easing in 2025-26); zero-enrolment schools (a temporary rise in 2023-24 before a sharp, sustained fall).
- Areas of stagnation or concern: Rainwater harvesting coverage has barely moved in four years (28.0%→29.9%); playground availability slipped slightly in the latest year; Middle-stage dropout rose marginally in 2025-26 after three years of decline.
- Standout performer: Secondary-stage indicators (GER, retention, dropout) show the strongest sustained gains of any stage — the system appears to be successfully addressing what was historically its weakest link.
Taken together, the four-year trend affirms steady progress toward the NEP 2020 goals of universal access, equity and improved retention, while flagging rainwater harvesting, playground space and Middle-stage dropout as the specific areas needing renewed attention going into 2026-27.
Source: Ministry of Education / Press Information Bureau — UDISE+ 2024-25 report (28 Aug 2025) and UDISE+ 2025-26 “Beyond the Numbers” report (17 Aug 2026).