SI Units: Fundamental and Derived Units
Table of Contents
There are two major systems of units used in the world: SI units (acronym for the French Le Système International d’Unités, also known as the metric system), and English units (also known as the imperial system). English units were historically used in nations once ruled by the British Empire. Today, the United States is the only country that still uses English units extensively.
Virtually every other country in the world now uses the metric system, which is the standard system agreed upon by scientists and mathematicians.
Some physical quantities are more fundamental than others. In physics, there are seven fundamental physical quantities that are measured in base or physical fundamental units: length, mass, time, electric current temperature, amount of substance, and luminous intensity. Units for other physical quantities (such as force, speed, and electric charge) described by mathematically combining these seven base units. In this course, we will mainly use five of these: length, mass, time, electric current and temperature. The units in which they are measured are the meter, kilogram, second, ampere, kelvin, mole, and candela (Table 1.1). All other units are made by mathematically combining the fundamental units. These are called derived units.
| Length | Meter | m |
| Mass | Kilogram | kg |
| Time | Second | s |
| Electric current | Ampere | a |
| Temperature | Kelvin | k |
| Amount of substance | Mole | mol |
| Luminous intensity | Candela | cd |
The Meter
The SI unit for length is the meter (m). The definition of the meter has changed over time to become more accurate and precise. The meter was first defined in 1791 as 1/10,000,000 of the distance from the equator to the North Pole. This measurement was improved in 1889 by redefining the meter to be the distance between two engraved lines on a platinum-iridium bar. (The bar is now housed at the International Bureau of Weights and Meaures, near Paris). By 1960, some distances could be measured more precisely by comparing them to wavelengths of light. The meter was redefined as 1,650,763.73 wavelengths of orange light emitted by krypton atoms. In 1983, the meter was given its present definition as the distance light travels in a vacuum in 1/ 299,792,458 of a second (Figure 1.14).
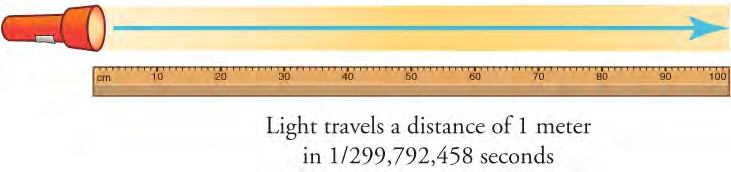
Figure 1.14 The meter is defined to be the distance light travels in 1/299,792,458 of a second through a vacuum. Distance traveled is speed multiplied by time.
The Kilogram
The SI unit for mass is the kilogram (kg). It is defined to be the mass of a platinum-iridium cylinder, housed at the International Bureau of Weights and Measures near Paris. Exact replicas of the standard kilogram cylinder are kept in numerous locations throughout the world, such as the National Institute of Standards and Technology in Gaithersburg, Maryland. The determination of all other masses can be done by comparing them with one of these standard kilograms.
The Second
The SI unit for time, the second (s) also has a long history. For many years it was defined as 1/86,400 of an average solar day. However, the average solar day is actually very gradually getting longer due to gradual slowing of Earth’s rotation. Accuracy in the fundamental units is essential, since all other measurements are derived from them. Therefore, a new standard was adopted to define the second in terms of a non-varying, or constant, physical phenomenon. One constant phenomenon is the very steady vibration of Cesium atoms, which can be observed and counted. This vibration forms the basis of the cesium atomic clock. In 1967, the second was redefined as the time required for 9,192,631,770 Cesium atom vibrations (Figure 1.15).
The Ampere
Electric current is measured in the ampere (A), named after Andre Ampere. You have probably heard of amperes, or amps, when people discuss electrical currents or electrical devices. Understanding an ampere requires a basic understanding of electricity and magnetism, something that will be explored in depth in later chapters of this book. Basically, two parallel wires with an electric current running through them will produce an attractive force on each other. One ampere is defined as the amount of electric current that will produce an attractive force of 2.7 10–7 newton per meter of separation between the two wires (the newton is the derived unit of force).
Kelvins
The SI unit of temperature is the kelvin (or kelvins, but not degrees kelvin). This scale is named after physicist William Thomson, Lord Kelvin, who was the first to call for an absolute temperature scale. The Kelvin scale is based on absolute zero. This is the point at which all thermal energy has been removed from all atoms or molecules in a system. This temperature, 0 K, is equal to −273.15 °C and −459.67 °F. Conveniently, the Kelvin scale actually changes in the same way as the Celsius scale. For example, the freezing point (0 °C) and boiling points of water (100 °C) are 100 degrees apart on the Celsius scale. These two temperatures are also 100 kelvins apart (freezing point = 273.15 K; boiling point = 373.15 K).
Metric Prefixes
Physical objects or phenomena may vary widely. For example, the size of objects varies from something very small (like an atom) to something very large (like a star). Yet the standard metric unit of length is the meter. So, the metric system includes many prefixes that can be attached to a unit. Each prefix is based on factors of 10 (10, 100, 1,000, etc., as well as 0.1, 0.01, 0.001, etc.). Table 1.2 gives the metric prefixes and symbols used to denote the different various factors of 10 in the metric system.
| Prefix | Symbol | Value[1] | Example Name | Example Symbol | Example Value | Example Description |
| exa | E | 1018 | Exameter | Em | 1018 m | Distance light travels in a century |
| peta | P | 1015 | Petasecond | Ps | 1015 s | 30 million years |
| tera | T | 1012 | Terawatt | TW | 1012 W | Powerful laser output |
| giga | G | 109 | Gigahertz | GHz | 109 Hz | A microwave frequency |
| mega | M | 106 | Megacurie | MCi | 106 Ci | High radioactivity |
| kilo | k | 103 | Kilometer | km | 103 m | About 6/10 mile |
| hector | h | 102 | Hectoliter | hL | 102 L | 26 gallons |
| deka | da | 101 | Dekagram | dag | 101 g | Teaspoon of butter |
| deci | d | 10–1 | Deciliter | dL | 10–1 L | Less than half a soda |
| centi | c | 10–2 | Centimeter | Cm | 10–2 m | Fingertip thickness |
| milli | m | 10–3 | Millimeter | Mm | 10–3 m | Flea at its shoulder |
| micro | µ | 10–6 | Micrometer | µm | 10–6 m | Detail in microscope |
| nano | n | 10–9 | Nanogram | Ng | 10–9 g | Small speck of dust |
| pico | p | 10–12 | Picofarad | pF | 10–12 F | Small capacitor in radio |
| femto | f | 10–15 | Femtometer | Fm | 10–15 m | Size of a proton |
| atto | a | 10–18 | Attosecond | as | 10–18 s | Time light takes to cross an atom |
Table 1.2 Metric Prefixes for Powers of 10 and Their Symbols [1]See Appendix A for a discussion of powers of 10. Note—Some examples are approximate
The metric system is convenient because conversions between metric units can be done simply by moving the decimal place of a number. This is because the metric prefixes are sequential powers of 10. There are 100 centimeters in a meter, 1000 meters in a kilometer, and so on. In nonmetric systems, such as U.S. customary units, the relationships are less simple—there are 12 inches in a foot, 5,280 feet in a mile, 4 quarts in a gallon, and so on. Another advantage of the metric system is that the same unit can be used over extremely large ranges of values simply by switching to the most-appropriate metric prefix. For example, distances in meters are suitable for building construction, but kilometers are used to describe road construction. Therefore, with the metric system, there is no need to invent new units when measuring very small or very large objects—you just have to move the decimal point (and use the appropriate prefix).
Known Ranges of Length, Mass, and Time
Table 1.3 lists known lengths, masses, and time measurements. You can see that scientists use a range of measurement units. This wide range demonstrates the vastness and complexity of the universe, as well as the breadth of phenomena physicists study. As you examine this table, note how the metric system allows us to discuss and compare an enormous range of phenomena, using one system of measurement (Figure 1.16 and Figure 1.17).
| Length (m) | Phenomenon Measured | Mass (Kg) | Phenomenon Measured[1] | Time (s) | Phenomenon Measured[1] |
| 10–18 | Present experimental limit to smallest observable detail | 10–30 | Mass of an electron (9.11×10⁻³¹ kg) | 10–23 | Time for light to cross a proton |
| 10–15 | Diameter of a proton | 10–27 | Mass of a hydrogen atom (1.67×10⁻²⁷ kg) | 10–22 | Mean life of an extremely unstable nucleus |
| 1014 | Diameter of a uranium nucleus | 10–15 | Mass of a bacterium | 10–15 | Time for one oscillation of a visible light |
| 10–10 | Diameter of a hydrogen atom | 10–5 | Mass of a mosquito | 10–13 | Time for one vibration of an atom in a solid |
| 10–8 | Thickness of membranes in cell of living organism | 10–2 | Mass of a hummingbird | 10–8 | Time for one oscillation of an FM radio wave |
| 10–6 | Wavelength of visible light | 1 | Mass of a liter of water (about a quart) | 10–3 | Duration of a nerve impulse |
| 10–3 | Size of a grain of sand | 102 | Mass of a person | 1 | Time for one heartbeat |
| 1 | Height of a 4-year-old child | 103 | Mass of a car | 105 | One day (8.64×10⁴ s) |
| 102 | Length of a football field | 108 | Mass of a large ship | 107 | One day (3.16×10⁷ s) |
| 104 | Greatest ocean depth | 1012 | Mass of a large iceberg | 109 | About half the life expectancy of a human |
| 107 | Diameter of Earth | 1015 | Mass of the nucleus of a comet | 1011 | Recorded history |
| 1011 | Distance from Earth to the sun | 1023 | Mass of the moon (7.35×10²² kg) | 1017 | Age of Earth |
| 1016 | Distance traveled by light in 1 year (a light year) | 1025 | Mass of Earth (5.97×1024kg) | 1018 | Age of the universe |
| 1021 | Diameter of the Milky Way Galaxy | 1030 | Mass of the Sun (1.99×1034 kg) | ||
| 1022 | Distance from Earth to the nearest large galaxy (Andromeda) | 1042 | Mass of the Milky Way galaxy (current upper limit) | ||
| 1026 | Distance from Earth to the edges of the known universe | 1053 | Mass of the known universe (current upper limit) |

Using Scientific Notation with Physical Measurements
Scientific notation is a way of writing numbers that are too large or small to be conveniently written as a decimal. For example, consider the number 840,000,000,000,000. It’s a rather large number to write out. The scientific notation for this number is 8.40 x 10¹⁴. Scientific notation follows this general format
x x 10y
In this format x is the value of the measurement with all placeholder zeros removed. In the example above, x is 8.4. The x is multiplied by a factor, 10y, which indicates the number of placeholder zeros in the measurement. Placeholder zeros are those at the end of a number that is 10 or greater, and at the beginning of a decimal number that is less than 1. In the example above, the factor is 1014. This tells you that you should move the decimal point 14 positions to the right, filling in placeholder zeros as you go. In this case, moving the decimal point 14 places creates only 13 placeholder zeros, indicating that the actual measurement value is 840,000,000,000,000.
Numbers that are fractions can be indicated by scientific notation as well. Consider the number 0.0000045. Its scientific notation is 4.5 x 10⁻⁶. Its scientific notation has the same format
x x 10y
Here, x is 4.5. However, the value of y in the 10y factor is negative, which indicates that the measurement is a fraction of 1. Therefore, we move the decimal place to the left, for a negative y. In our example of 4.5 x 10⁻⁶, the decimal point would be moved to the left six times to yield the original number, which would be 0.0000045.
The term order of magnitude refers to the power of 10 when numbers are expressed in scientific notation. Quantities that have the same power of 10 when expressed in scientific notation, or come close to it, are said to be of the same order of magnitude. For example, the number 800 can be written as 8 102, and the number 450 can be written as 4.5
102. Both numbers have the same value for y. Therefore, 800 and 450 are of the same order of magnitude. Similarly, 101 and 99 would be regarded as the same order of magnitude, 102. Order of magnitude can be thought of as a ballpark estimate for the scale of a value. The diameter of an atom is on the order of 10−9 m, while the diameter of the sun is on the order of 109 m. These two values are 18 orders of magnitude apart.
Scientists make frequent use of scientific notation because of the vast range of physical measurements possible in the universe, such as the distance from Earth to the moon (Figure 1.18), or to the nearest star.

Unit Conversion and Dimensional Analysis
It is often necessary to convert from one type of unit to another. For example, if you are reading a European cookbook in the United States, some quantities may be expressed in liters and you need to convert them to cups. A Canadian tourist driving through the United States might want to convert miles to kilometers, to have a sense of how far away his next destination is. A doctor in the United States might convert a patient’s weight in pounds to kilograms.
Let’s consider a simple example of how to convert units within the metric system. How can we want to convert 1 hour to seconds?
Next, we need to determine a conversion factor relating meters to kilometers. A conversion factor is a ratio expressing how many of one unit are equal to another unit. A conversion factor is simply a fraction which equals 1. You can multiply any number by 1 and get the same value. When you multiply a number by a conversion factor, you are simply multiplying it by one. For example, the following are conversion factors: (1 foot)/(12 inches) = 1 to convert inches to feet, (1 meter)/(100 centimeters) = 1 to convert centimeters to meters, (1 minute)/(60 seconds) = 1 to convert seconds to minutes. In this case, we know that there are 1,000 meters in 1 kilometer.
Now we can set up our unit conversion. We will write the units that we have and then multiply them by the conversion factor (1 km/1,000m) = 1, so we are simply multiplying 80m by 1:
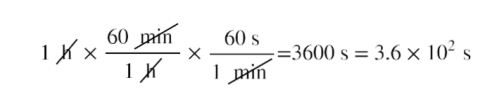
When there is a unit in the original number, and a unit in the denominator (bottom) of the conversion factor, the units cancel. In this case, hours and minutes cancel and the value in seconds remains.
You can use this method to convert between any types of unit, including between the U.S. customary system and metric system. Notice also that, although you can multiply and divide units algebraically, you cannot add or subtract different units. An expression like 10 km + 5 kg makes no sense. Even adding two lengths in different units, such as 10 km + 20 m does not make sense. You express both lengths in the same unit. See Appendix C for a more complete list of conversion factors.
Worked Example
Unit Conversions: A Short Drive Home
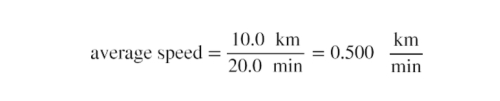
Suppose that you drive the 10.0 km from your university to home in 20.0 min. Calculate your average speed (a) in kilometers per hour (km/h) and (b) in meters per second (m/s). (Note—Average speed is distance traveled divided by time of travel.)
Strategy
First we calculate the average speed using the given units. Then we can get the average speed into the desired units by picking the correct conversion factor and multiplying by it. The correct conversion factor is the one that cancels the unwanted unit and leaves the desired unit in its place.
Solution for (a)
1.Calculate average speed. Average speed is distance traveled divided by time of travel. (Take this definition as a given for now—average speed and other motion concepts will be covered in a later module.) In equation form,

2. Substitute the given values for distance and time.
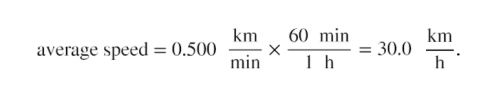
3. Convert km/min to km/h: multiply by the conversion factor that will cancel minutes and leave hours. That conversion factor is 60 min/1h . Thus
Discussion for (a)
To check your answer, consider the following:
- Be sure that you have properly cancelled the units in the unit conversion. If you have written the unit conversion factor upside down, the units will not cancel properly in the equation. If you accidentally get the ratio upside down, then the units will not cancel; rather, they will give you the wrong units as follows

which are obviously not the desired units of km/h.
2. Check that the units of the final answer are the desired units. The problem asked us to solve for average speed in units of km/h and we have indeed obtained these units.
3. Check the significant figures. Because each of the values given in the problem has three significant figures, the answer should also have three significant figures. The answer 30.0 km/h does indeed have three significant figures, so this is appropriate. Note that the significant figures in the conversion factor are not relevant because an hour is defined to be 60 min, so the precision of the conversion factor is perfect.
4. Next, check whether the answer is reasonable. Let us consider some information from the problem—if you travel 10 km in a third of an hour (20 min), you would travel three times that far in an hour. The answer does seem reasonable.
Worked Example
Using Physics to Evaluate Promotional Materials
A commemorative coin that is 2″ in diameter is advertised to be plated with 15 mg of gold. If the density of gold is 19.3 g/cc, and the amount of gold around the edge of the coin can be ignored, what is the thickness of the gold on the top and bottom faces of the coin?
Strategy
To solve this problem, the volume of the gold needs to be determined using the gold’s mass and density. Half of that volume is distributed on each face of the coin, and, for each face, the gold can be represented as a cylinder that is 2″ in diameter with a height equal to the thickness. Use the volume formula for a cylinder to determine the thickness.
Solution
Discussion
The amount of gold used is stated to be 15 mg, which is equivalent to a thickness of about 0.00019 mm. The mass figure may make the amount of gold sound larger, both because the number is much bigger (15 versus 0.00019), and because people may have a more intuitive feel for how much a millimeter is than for how much a milligram is. A simple analysis of this sort can clarify the significance of claims made by advertisers.
Accuracy, Precision and Significant Figures
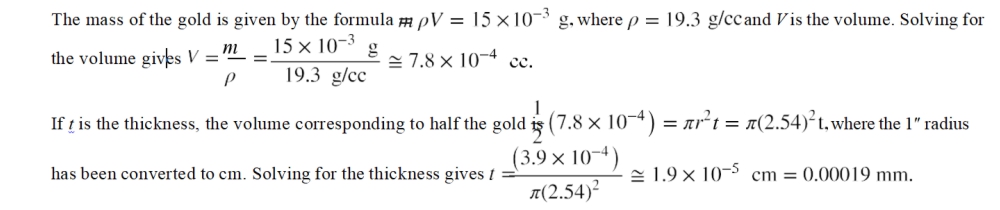
Science is based on experimentation that requires good measurements. The validity of a measurement can be described in terms of its accuracy and its precision (see Figure 1.19 and Figure 1.20). Accuracy is how close a measurement is to the correct value for that measurement. For example, let us say that you are measuring the length of standard piece of printer paper. The packaging in which you purchased the paper states that it is 11 inches long, and suppose this stated value is correct. You measure the length of the paper three times and obtain the following measurements: 11.1 inches, 11.2 inches, and 10.9 inches. These measurements are quite accurate because they are very close to the correct value of 11.0 inches. In contrast, if you had obtained a measurement of 12 inches, your measurement would not be very accurate. This is why measuring instruments are calibrated based on a known measurement. If the instrument consistently returns the correct value of the known measurement, it is safe for use in finding unknown values.
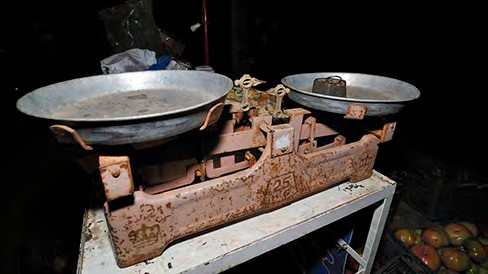
Figure 1.19 A double-pan mechanical balance is used to compare different masses. Usually an object with unknown mass is placed in one pan and objects of known mass are placed in the other pan. When the bar that connects the two pans is horizontal, then the masses in both pans are equal. The known masses are typically metal cylinders of standard mass such as 1 gram, 10 grams, and 100 grams. (Serge Melki)
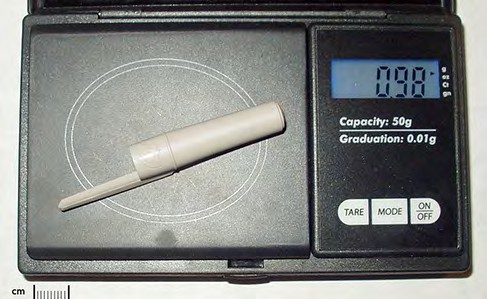
Figure 1.20 Whereas a mechanical balance may only read the mass of an object to the nearest tenth of a gram, some digital scales can measure the mass of an object up to the nearest thousandth of a gram. As in other measuring devices, the precision of a scale is limited to the last measured figures. This is the hundredths place in the scale pictured here. (Splarka, Wikimedia Commons)
Precision states how well repeated measurements of something generate the same or similar results. Therefore, the precision of measurements refers to how close together the measurements are when you measure the same thing several times. One way to analyze the precision of measurements would be to determine the range, or difference between the lowest and the highest measured values. In the case of the printer paper measurements, the lowest value was 10.9 inches and the highest value was 11.2 inches. Thus, the measured values deviated from each other by, at most, 0.3 inches. These measurements were reasonably precise because they varied by only a fraction of an inch. However, if the measured values had been 10.9 inches, 11.1 inches, and 11.9 inches, then the measurements would not be very precise because there is a lot of variation from one measurement to another.
The measurements in the paper example are both accurate and precise, but in some cases, measurements are accurate but not precise, or they are precise but not accurate. Let us consider a GPS system that is attempting to locate the position of a restaurant in a city. Think of the restaurant location as existing at the center of a bull’s-eye target. Then think of each GPS attempt to locate the restaurant as a black dot on the bull’s eye.
In Figure 1.21, you can see that the GPS measurements are spread far apart from each other, but they are all relatively close to the actual location of the restaurant at the center of the target. This indicates a low precision, high accuracy measuring system.
However, in Figure 1.22, the GPS measurements are concentrated quite closely to one another, but they are far away from the target location. This indicates a high precision, low accuracy measuring system. Finally, in Figure 1.23, the GPS is both precise and accurate, allowing the restaurant to be located.
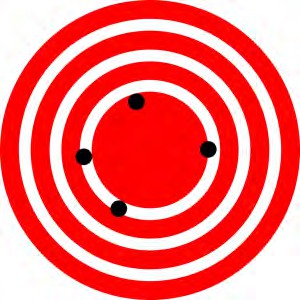
Figure 1.21 A GPS system attempts to locate a restaurant at the center of the bull’s-eye. The black dots represent each attempt to pinpoint the location of the restaurant. The dots are spread out quite far apart from one another, indicating low precision, but they are each rather close to the actual location of the restaurant, indicating high accuracy. (Dark Evil)
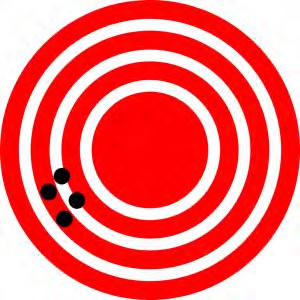
Figure 1.22 In this figure, the dots are concentrated close to one another, indicating high precision, but they are rather far away from the actual location of the restaurant, indicating low accuracy. (Dark Evil)
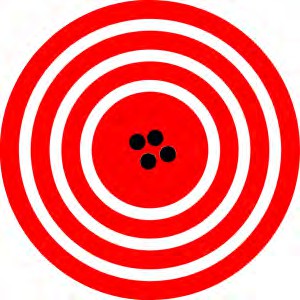
Figure 1.23 In this figure, the dots are concentrated close to one another, indicating high precision, but they are rather far away from the actual location of the restaurant, indicating low accuracy. (Dark Evil)
Uncertainty
The accuracy and precision of a measuring system determine the uncertainty of its measurements. Uncertainty is a way to describe how much your measured value deviates from the actual value that the object has. If your measurements are not very accurate or precise, then the uncertainty of your values will be very high. In more general terms, uncertainty can be thought of as a disclaimer for your measured values. For example, if someone asked you to provide the mileage on your car, you might say that it is 45,000 miles, plus or minus 500 miles. The plus or minus amount is the uncertainty in your value. That is, you are indicating that the actual mileage of your car might be as low as 44,500 miles or as high as 45,500 miles, or anywhere in between. All measurements contain some amount of uncertainty. In our example of measuring the length of the paper, we might say that the length of the paper is 11 inches plus or minus 0.2 inches or 11.0 ± 0.2 inches. The uncertainty in a
measurement, A, is often denoted as δA (“delta A“),
The factors contributing to uncertainty in a measurement include the following:
- Limitations of the measuring device
- The skill of the person making the measurement
- Irregularities in the object being measured
- Any other factors that affect the outcome (highly dependent on the situation)
In the printer paper example uncertainty could be caused by: the fact that the smallest division on the ruler is 0.1 inches, the person using the ruler has bad eyesight, or uncertainty caused by the paper cutting machine (e.g., one side of the paper is slightly longer than the other.) It is good practice to carefully consider all possible sources of uncertainty in a measurement and reduce or eliminate them,
Percent Uncertainty
One method of expressing uncertainty is as a percent of the measured value. If a measurement, A, is expressed with uncertainty,
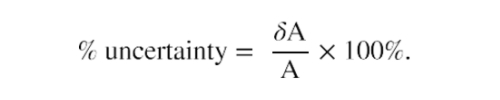
Uncertainty in Calculations
There is an uncertainty in anything calculated from measured quantities. For example, the area of a floor calculated from measurements of its length and width has an uncertainty because the both the length and width have uncertainties. How big is the uncertainty in something you calculate by multiplication or division? If the measurements in the calculation have small uncertainties (a few percent or less), then the method of adding percents can be used. This method says that the percent uncertainty in a quantity calculated by multiplication or division is the sum of the percent uncertainties in the items used to make the calculation. For example, if a floor has a length of 4.00 m and a width of 3.00 m, with uncertainties of 2 percent and 1 percent, respectively, then the area of the floor is 12.0 m2 and has an uncertainty of 3 percent (expressed as an area this is 0.36 m2, which we round to 0.4 m2 since the area of the floor is given to a tenth of a square meter).
For a quick demonstration of the accuracy, precision, and uncertainty of measurements based upon the units of measurement, try this simulation (http://openstax.org/l/28precision) . You will have the opportunity to measure the length and weight of a desk, using milli- versus centi- units. Which do you think will provide greater accuracy, precision and uncertainty when measuring the desk and the notepad in the simulation? Consider how the nature of the hypothesis or research question might influence how precise of a measuring tool you need to collect data.
Precision of Measuring Tools and Significant Figures
An important factor in the accuracy and precision of measurements is the precision of the measuring tool. In general, a precise measuring tool is one that can measure values in very small increments. For example, consider measuring the thickness of a coin. A standard ruler can measure thickness to the nearest millimeter, while a micrometer can measure the thickness to the nearest 0.005 millimeter. The micrometer is a more precise measuring tool because it can measure extremely small differences in thickness. The more precise the measuring tool, the more precise and accurate the measurements can be.
When we express measured values, we can only list as many digits as we initially measured with our measuring tool (such as the rulers shown in Figure 1.24). For example, if you use a standard ruler to measure the length of a stick, you may measure it with a decimeter ruler as 3.6 cm. You could not express this value as 3.65 cm because your measuring tool was not precise enough to measure a hundredth of a centimeter. It should be noted that the last digit in a measured value has been estimated in some way by the person performing the measurement. For example, the person measuring the length of a stick with a ruler notices that the stick length seems to be somewhere in between 36 mm and 37 mm. He or she must estimate the value of the last digit. The rule is that the last digit written down in a measurement is the first digit with some uncertainty. For example, the last measured value 36.5 mm has three digits, or three significant figures. The number of significant figures in a measurement indicates the precision of the measuring tool. The more precise a measuring tool is, the greater the number of significant figures it can report.
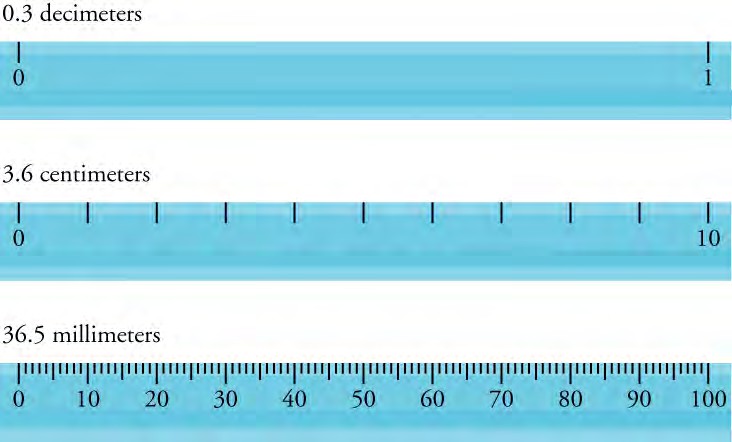
Figure 1.24 Three metric rulers are shown. The first ruler is in decimeters and can measure point three decimeters. The second ruler is in centimeters long and can measure three point six centimeters. The last ruler is in millimeters and can measure thirty-six point five millimeters.
Zeros
Special consideration is given to zeros when counting significant figures. For example, the zeros in 0.053 are not significant because they are only placeholders that locate the decimal point. There are two significant figures in 0.053—the 5 and the 3. However, if the zero occurs between other significant figures, the zeros are significant. For example, both zeros in 10.053 are significant, as these zeros were actually measured. Therefore, the 10.053 placeholder has five significant figures. The zeros in 1300 may or may not be significant, depending on the style of writing numbers. They could mean the number is known to the last zero, or the zeros could be placeholders. So 1300 could have two, three, or four significant figures. To avoid this ambiguity, write 1300 in scientific notation as 1.3 × 10³. Only significant figures are given in the x factor for a number in scientific notation (in the form x x 10y). Therefore, we know that 1 and 3 are the only significant digits in this number. In summary, zeros are significant except when they serve only as placeholders. Table 1.4 provides examples of the number of significant figures in various numbers.
| Number | Significant Figures | Rationale |
| 1.657 | 4 | There are no zeros and all non-zero numbers are always significant. |
| 0.4578 | 4 | The first zero is only a placeholder for the decimal point. |
| 0.000458 | 3 | The first four zeros are placeholders needed to report the data to the ten-thoudsandths place. |
| 2000.56 | 6 | The three zeros are significant here because they occur between other significant figures. |
| 45,600 | 3 | With no underlines or scientific notation, we assume that the last two zeros are placeholders and are not significant. |
| 15895000 | 7 | The two underlined zeros are significant, while the last zero is not, as it is not underlined. |
| 5.457 x | 4 | In scientific notation, all numbers reported in front of the multiplication sign are significant |
| 6.520 x 10⁻²³ | 4 | In scientific notation, all numbers reported in front of the multiplication sign are significant, including zeros. |
Table 1.4
Significant Figures in Calculations
When combining measurements with different degrees of accuracy and precision, the number of significant digits in the final answer can be no greater than the number of significant digits in the least precise measured value. There are two different rules, one for multiplication and division and another rule for addition and subtraction, as discussed below.
- For multiplication and division: The answer should have the same number of significant figures as the starting value with the fewest significant figures. For example, the area of a circle can be calculated from its radius using A = πr2 . Let us see how many significant figures the area will have if the radius has only two significant figures, for example, r = 2.0 m. Then, using a calculator that keeps eight significant figures, you would get
A = πr2 = (3.1415927…) x (2.0 m)2 = 4.5238934 m2
But because the radius has only two significant figures, the area calculated is meaningful only to two significant figures or
A = 4.5 m2
even though the value of is meaningful to at least eight digits.
- For addition and subtraction: The answer should have the same number places (e.g. tens place, ones place, tenths place, etc.) as the least-precise starting value. Suppose that you buy 7.56 kg of potatoes in a grocery store as measured with a scale having a precision of 0.01 kg. Then you drop off 6.052 kg of potatoes at your laboratory as measured by a scale with a precision of 0.001 kg. Finally, you go home and add 13.7 kg of potatoes as measured by a bathroom scale with a precision of 0.1 kg. How many kilograms of potatoes do you now have, and how many significant figures are appropriate in the answer? The mass is found by simple addition and subtraction:
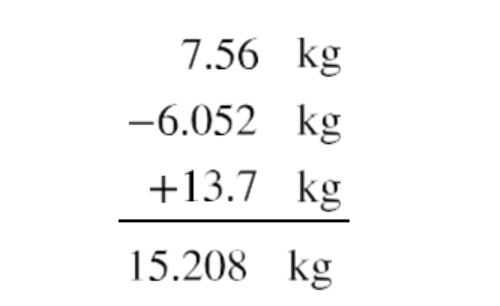
The least precise measurement is 13.7 kg. This measurement is expressed to the 0.1 decimal place, so our final answer must also be expressed to the 0.1 decimal place. Thus, the answer should be rounded to the tenths place, giving 15.2 kg. The same is true for non-decimal numbers. For example,
6527.23 + 2 = 6528.23 = 6528
We cannot report the decimal places in the answer because 2 has no decimal places that would be significant. Therefore, we can only report to the ones place.
(You can access this textbook for free in web view or PDF through OpenStax.org, and for a low cost in print)
Take Quiz
1. A car engine moves a piston with a circular cross section of 7.500 ± 0.002 cm diameter a distance of 3.250±0.001 cm to compress the gas in the cylinder. By what amount did the gas decrease in volume in cubic centimeters? Find the uncertainty in this volume
- 143.6 ± 0.002 cm3
- 143.6 ± 0.003 cm3
- 143.6 ± 0.005 cm3
- 143.6 ± 0.1 cm3
ANSWER
d) 143.6 ± 0.1 cm3
2) The sides of a small rectangular box are measured 1.80 cm and 2.50cm long and 3.1 cm high. Calculate its volume and uncertainty in cubic centimeters. Assume the measuring device is accurate to ± 0.05 cm
- 11.4 ± 0.1 cm3
- 11.4 ± 0.6 cm3
- 11.4 ± 0.8 cm3
- 11.4 ± 0.10 cm3
ANSWER
b) 11.4 ± 0.6 cm3
3) Calculate the approximate number of atoms in a bacterium. Assume that the average mass of an atom in the bacterium is ten times the mass of a hydrogen atom. (Hint—The mass of a hydrogen atom is on the order of 10−27 kg and the mass of a bacterium is on the order of 10−15 kg .)
- 1010 atoms
- 1011 atoms
- 1012 atoms
- 1013 atoms
ANSWER
b) 1011 atoms
4) Suppose that a bathroom scale reads a person’s mass as 65 kg with a 3 percent uncertainty. What is the uncertainty in their mass in kilograms?
a. 2 kg
b. 98 kg
c. 5 kg
d. 0
ANSWER
a) 2 kg
5) The speed of sound is measured at 342 m/s on a certain day. What is this in km/h ? Report your answer in scientific notation
- 1.23 X 10 4 Kmph
- 1.23 X 10 3 Kmph
- 9.5 X 10 1 Kmph
- 2.05 X 10 -1 Kmph
ANSWER
b) 1.23 X 10 3 Kmph
6) Tectonic plates are large segments of the Earth’s crust that move slowly . Suppose one such plate has an average speed of 4.0 cm / year . What distance does it move in 1 second at this speed ?
- 1.3 X 10⁻⁹ m
- 1.3 X 10⁻⁶ m
- 1.3 X 10– 10 m
- 1.3 X 10– 4 m
ANSWER
c) 1.3 X 10– 10 m